SimKube: Part 3 - Tracing a Cluster

This is the third part of a (at least) four-part series on simulation in Kubernetes. Here’s the outline of the rest of the series, I will update this with links to future posts as I write them:
- Part 1 - Why do we need a simulator?
- Part 2 - Building a simulated cluster with Virtual Kubelet
- Part 3 (this post) - Recording traces and replaying them
- Part 4 (sometime in the future) - Analyzing the data
What on earth happened to my cluster?
In our last two posts in this series, I hopefully convinced you that having a simulator for Kubernetes is a good idea, and showed how we can build a virtual cluster to run simulations on. In this post, I’m going to talk a bit about how we can provide input data into our simulator.
Let’s first try to understand the use case(s) here. I can think of at least three:
- I’m making a change to some component in my cluster and want to know how it will behave.
- I’m anticipating a big surge in traffic and want to make sure my scheduler can handle it.
- Something went wrong in one of my real clusters, and I want to either understand/reproduce it, or show that my proposed fix actually would prevent the issue from re-occurring.
For cases 1 and 2, you can imagine that a sufficiently advanced random generator might be able to prove that your system works as intended and can scale. But, for case 3, you have to be able to replay the exact sequence of events that caused the issue in the first place. Otherwise, you don’t know whether you actually fixed the problem or whether your input data just didn’t lead to the circumstances that caused the problem in the first place.
Some thought hopefully will convince you that recording these “event traces” (as I’m calling them) is pretty challenging. In a production Kubernetes cluster of any significant size, there are dozens or hundreds of events happening every minute. Some of these are noise (for the purposes of simulation) and some of them are important. How are you going to keep track of them all?
At first glance, it seems like one of our existing monitoring/observability tools like Prometheus might be able to do this for us. After all, they’re already tracking all of these events and stuffing them into an efficient time-series database. Most companies are running Prometheus or something that is Prometheus-compatible, so this would also be great for adoption—if I can just already utilize my pre-existing observability stack and plug that into my simulation engine, that’s great news. Right?
Well, except, it’s not that simple. In order to maintain computational and storage efficiency, monitoring tools like Prometheus do a lot of data aggregation up-front. Or, to put it another way, they are lossy engines: they throw out data in order to get something that is approximately correct. But remember what I said about needing to replay the exact trace1? So after some reflection and conversations, I began to realize that’s not actually that helpful. What we actually need is the unaggregated stream of relevant events.
So that’s what I built.
Hold up a sec. You’re using Rust again?
YES, I’m using Rust again. No, I’m not some kind of shill.
But why? Everything else is in Go.
Yes, yes, I know. Look, I’ll probably have a post coming up in the future where I discuss the pros and cons of each of the languages, and I’m sure that post will be completely reasonable and won’t incite any flamewars at all.
For now, though, I wanted to get more experience with the Rust+Kubernetes ecosystem, so that when I get on to building bigger projects, I can make some informed decisions about the tradeoffs. Nothing that I’ve built for SimKube is that complicated, so it’s a good playground for me to experiment with, and if I really decide that Rust isn’t a good choice, it will be pretty straightforward to re-write in Go.
The one possible downside to this decision is it might limit the number of external contributors who can get involved with the project? But I don’t have any of those right now so that’s a problem for a future day :)
Now let’s move on and talk about the actual architecture.
The Actual Architecture
We’ve got three components that come into play when we want to record and replay a trace. The tracer is the thing that is actually watching events on a real cluster; the controller is a standard Kubernetes controller that watches for changes to a Simulation custom resource; and the driver is the component that actually replays a trace in a simulated cluster. None of these components are particularly complicated, but let’s take a closer look at each of them:
sk-tracer
The SimKube tracer component records events into a datastore (currently in-memory, but in the future it will snapshot data to persistent storage). We set up a standard Kubernetes watcher and save the events we care about to a timeseries data structure. The trickiest part is figuring out which events we care about. Initially, I was thinking that the only events we needed were pod creation and deletion—and actually this would work fine if the only thing you wanted to simulate was autoscaling behaviour—but as soon as you want to simulate anything else, you need to watch other objects as well2.
As far as the actual data structure we use to store the events, right now I’m using a simple array that looks like
[(ts1, events...), (ts2, events...), (ts3, events...), ...], where each ts is the timestamp that the event(s)
occurred, and the events at that timestamp are just a list of object creations, deletions, and updates. There are some
event filters in place to scrub events and data that we don’t care about, but if my back-of-the-envelope math is
correct, this should scale to reasonable-sized clusters and only use a handful of GBs of storage3. It’s possible in
the future we’ll need to replace this with a more robust timeseries database like Facebook’s
Gorilla.
sk-ctrl
The next component, the simulation controller, watches for new Simulation resources to be applied to the cluster, and
then it kicks off a simulation job to actually run the sim and collect data. Currently the Simulation custom resource
spec is trivial, though I expect to add more to this in the future:
pub struct SimulationSpec {
    driverNamespace: String,
    trace: String,
}
The driverNamespace field specifies the “root” namespace of the simulation where the driver pod will get created, and
the trace field specifies the location of the exported trace file from the tracer. When a Simulation gets created, the
controller’s only job is to create the driver pod4.
The one design pattern I’m using which I haven’t actually seen anywhere before is that I actually am creating two custom
resources in my cluster, a Simulation resource and a SimulationRoot resource. Both of these are cluster-scoped; the
Simulation is the external interface that users create, whereas the SimulationRoot exists as an internal
implementation detail that allows for easy cleanup. The idea is that every pod, namespace, etc. that gets created by my
simulation hangs off of the SimulationRoot, so that when it’s time to clean everything up I can just delete the
SimulationRoot object and take advantage of Kubernetes’s garbage collection
to clean up everything else5. The Simulation object will stick around until it’s manually cleaned up, so that
users can inspect the status/results of a completed simulation6.
sk-driver
Lastly, the simulation driver is the thing that actually runs the sim. It downloads the trace, unpacks it, and then iterates through the events in the trace, applying them at the appropriate times. In order to maintain isolation between the simulation and the rest of the cluster, it adds the appropriate taints and tolerations to the simulated pods so that they run on the virtual nodes instead of the real ones.
A reasonable question is, why not have the simulation controller actually be the thing that runs the simulation, instead of spawning off a separate pod for that? The main answer is that Kubernetes controllers are supposed to be idempotent and have a declarative interface. In other words, they’re supposed to respond somewhat quickly when something changes, and do approximately nothing at all other times. Without going into a ton of details, it is challenging to maintain this expectation and also have the controller managing a long-running process like the simulation driver7.
So, uh, that’s cool and all, but does it actually work?
You betcha! Here, take a look at this:
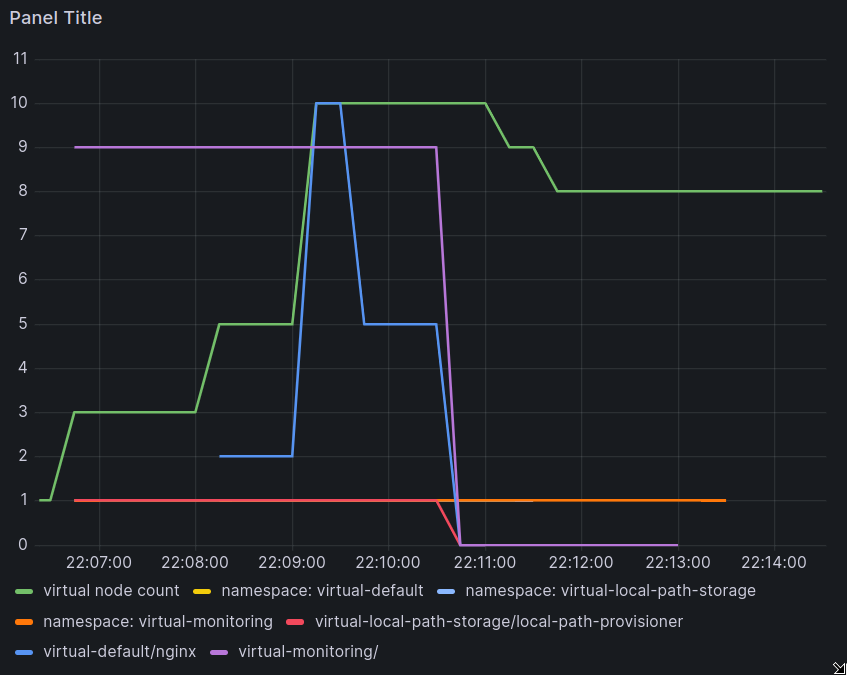
Ok there’s a bunch of lines in that there graph, let’s break it down a little bit. The most important line is the green one: this represents the number of virtual nodes in the cluster. You can see it starts at 1, and scales up to 10, before then scaling back down slightly. Why did it scale up?
Well, that’s the blue line: this is a virtual nginx deployment. Shortly after the simulation began, it was created with 2 pods. Then it scaled up to 10 pods, down to 5, and finally was deleted. The nginx deployment requested 1 CPU per pod, and each virtual node exposed a single CPU, so at the peak of the simulation, all 10 pods were scheduled to 10 virtual nodes.
What are the purple and red lines? Those are just pods from other namespaces that got scooped up in my exported trace; they didn’t request any resources at all, which means that they can get scheduled on my virtual nodes even though all the resources are used up. And the orange line is just showing that the driver created some extra namespaces to house all of my simulated objects, which then all got deleted after the simulation was over.
Pretty slick, huh?? I sure think so!
So what’s next in the simulation world?
The (supposedly) last part in this series is going to be talking about how we can visualize and compare the results of different simulation runs. Prometheus and Grafana are great tools, but they are at their core observability tools, not data analysis tools. It’s difficult, if not impossible, to import data from a bunch of different sources and do any sort of meaningful analysis on them. I have experimented a bit with using Jupyter to do this sort of analysis on experimental results from simulations, but the usability story there is also not great. So the short answer is… I don’t actually know how to do this yet, but it’s a problem that I need to be able to solve. That’s why my next post in this series is marked as coming “sometime”, because I don’t think I’m going to have a good answer for it in the next week.
Though, if any of you all have a good answer to this problem, I would love to hear from you!
Thanks for reading,
~drmorr
-
Remember, distributed systems are chaotic — meaning they are extremely sensitive to their initial conditions. Small changes in input = potentially large changes in output. ↩
-
Simple example: say you wanted to simulate a change to the maxUnavailable/maxSurge settings on a Deployment object. Well, then, just having access to the raw pod creations and deletions isn’t going to help. ↩
-
Let’s say each object uses 500kB data (a fairly significant overestimate). The Kubernetes SLOs page says that Kubernetes should be able to handle up to 20 podspec creations/updates/deletions in a given second, but I find it hard to believe that this rate of change is happening constantly in a real cluster. Let’s say that 5x/minute we see 20 podspec creations/updates/deletions in a second, so then 5x/minute we need to store 20 * 500kB of data. That means that a day’s worth of data takes 5 * 20 * 24 * 500 = 1.2GB of storage. Let’s, say, triple that to account for any indexes or other metadata we want to store: a trace of a large cluster should take ~5GB of storage. Large, yes; impossibly huge, definitely not. ↩
-
Eventually we want to add a bit more functionality here: we should make it so you can’t run multiple simulations at the same time, for example, and we’ll need to have some configuration for storing/saving/analyzing the data after a simulation is complete. ↩
-
I thought this was a clever idea, but the fact that I haven’t seen anybody else do this makes me wonder if it’s too clever. ↩
-
This is similar to how Kubernetes Jobs work: in order to let the user check the status of a job, they aren’t deleted immediately, though they will be garbage-collected eventually so they don’t take up space in etcd forever. ↩
-
Plus, running the driver in a separate pod opens up the possibility of having the driver running in a completely different cluster than the simulation controller, which could be useful for some sort of automatic testing workflow in CI: your test spins up a brand new cluster, runs the simulation on it, and then tears it down at the end. ↩